You can format any line whether it is an auxiliary line, a free-floating object, or a connecting line between boxes in a chart.
An auxiliary line is a line that you can draw between any two boxes in your chart to indicate a reporting relationship between them.
You can also add a label to any line. See Adding Labels, below, for information.
To format connecting lines:
1 With your chart open, select one or more lines.
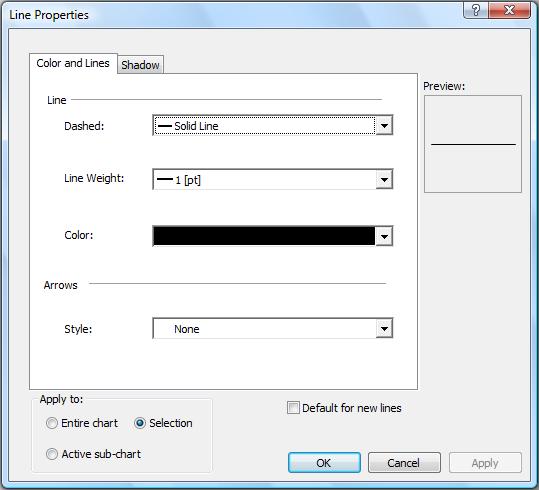
2 Select Line Properties from the Format menu to display the Line Properties dialog box.
3 Click the Color and Lines tab.
· Define the following:
· Line area:
· Color: Select the line color.
· Dashed: Select the line type.
· Line Weight: Select the line thickness.
Note:
You can also specify a custom line thickness using the  button in the Line Weight drop-down
list.
button in the Line Weight drop-down
list.
· Arrows area:
· Style: Select an arrow style.
· If you are working with an auxiliary line, the Options area appears:
· Auxiliary Lines: Pick a line format, to determine whether auxiliary lines are placed around or under existing boxes. The custom option allows you to drag the auxiliary line to the desired position.
4 Click the Shadow tab.
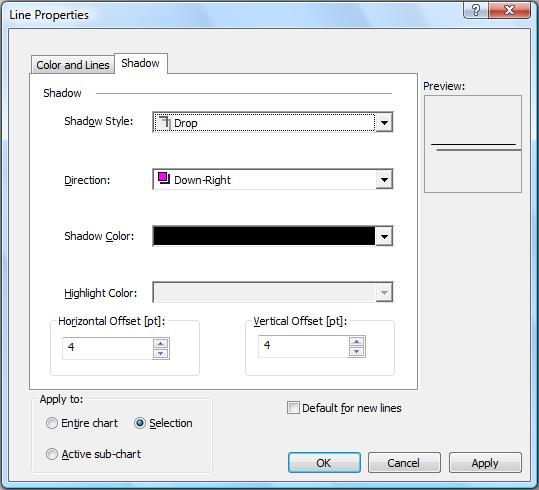
· Define the following:
· Shadow Style: Select a shadow style.
· Direction: Select a shadow direction (enabled only when a shadow is selected).
· Shadow Color: Select a shadow color (enabled only when a shadow is selected).
· Highlight Color: Select the shadow highlight color (enabled only for certain shadow styles).
· Horizontal Offset and Vertical Offset: Select the horizontal and vertical depth of the shadow.
5 Click OK to update the selected boxes.
You can add labels to lines of all types (auxiliary, reporting or free floating lines), to clarify relationships between employees.
To add a label to a line:
1 Right-click the line to which you want to add a label.
2 From the opened menu, select Insert Label.
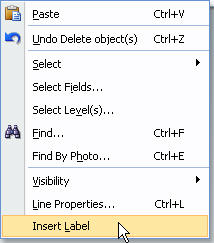
A small, empty label is added to the line.
3 Click
to select the label ![]() , and type the
information you want to appear in it.
, and type the
information you want to appear in it.
4 Click outside the label to save.
To format a label:
1 Click to select the label you want to format. To select multiple labels on a chart, use ctrl-click, or select Select | All Labels from the Edit menu.
2 Select Box Properties from the Format menu to display the Free Floating Object Properties dialog box.
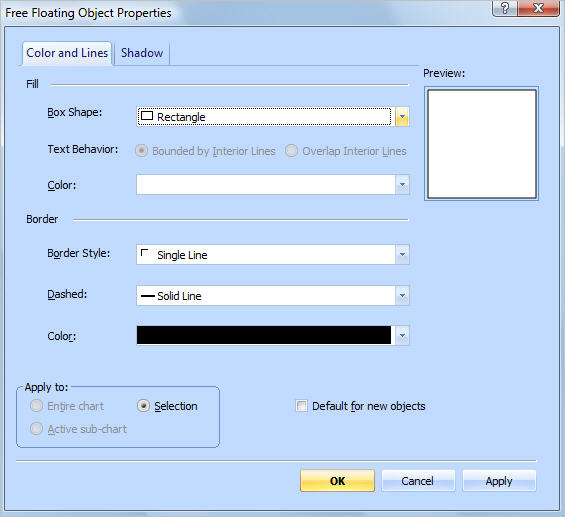
3 Click the Color and Lines tab.
4 Define necessary properties in the Fill area:
· Box Shape: Select a box shape.
· Text Behavior: This option becomes active if you are using a box shape with a bounding shape (Triangle in Rectangle, for example):
· Bounded by Interior Lines confines the label text to the interior shape.
· Overlap Interior Lines places the box text in the bounding box, disregarding the interior shape.
· Color: Select a background color.
5 Define necessary properties in the Border area:
· Color: Select the border line color.
· Dashed: Select the line type.
· Border Style: Select the border style.
6 Click the Shadow tab.
7 Define the properties:
· Shadow Style: Select the shadow style.
· Direction: Select a shadow direction (enabled only when a shadow is selected).
· Shadow Color: Select a shadow color (enabled only when a shadow is selected).
· Highlight Color: Select the shadow highlight color (enabled only for certain shadow styles).
· Horizontal Offset and Vertical Offset: Select the horizontal and vertical depth of the shadow.
8 Click OK to update the selected labels.